I posted up what I thought was a pretty fun blog last week, one that used illusions as the tool for communication. My initial intent on writing it was to use the illustrations as a metaphor for organizational innovation and creativity, but as I wrote, I poked a bit at management and leadership and perspectives. What bounced back were a lot of comments about the management themes that were mentioned. So, what the heck, go with the flow and all that…

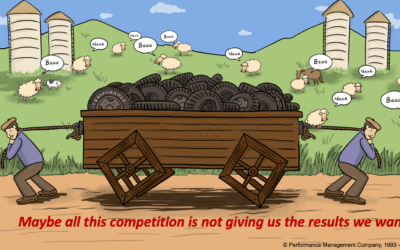
In the cartoon above, which I use like an inkblot test, I can generate a lot of involvement and engagement with people seeing how their organization tends to work. Not so much that they see it that way but more as how they perceive things to work. It’s useful, though, because it allows people to play and it gives them a language for how things work.
Okay, maybe things are different in Asia… Things there might look more like this:

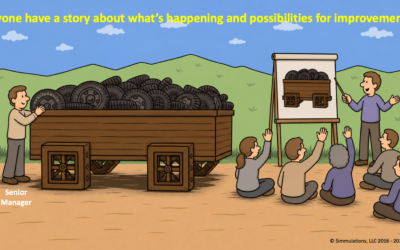
Square Wheels become “The things that don’t work smoothly” while round wheels become ideas for improvement and possibilities. The key is how to implement change and improvement and the workshop session stops the pushing and pulling for a period of time. Stepping back from the wagon is useful perspective, for sure. Perspective is good because it changes how we view things.
The reality is that many people in the workplace, as demonstrated by countless surveys and other research, actually see their time flowing something like this:

But I kid. Let’s move along to talk about how we think and how we see things and how our perceptions can influence our thinking. Take a look at this:

Consider the circle
In the above, it you actually take a few moments and look at it, the circle should remain in the center of the box for a while and then move to the back surface as the image shifts from right to left. Or, it might start left to right for you. I actually have trouble keeping it in the same place the more I look at it — it shifts regardless of how I want to see it look. My brain makes it change. I think the same thing occurs when one views performance from different perspectives.
The person who takes a lot of time with customers may not complete as many transactions per hour but they may contribute more money to the organization, over time, because their average sale might be higher or they have fewer customer complaints that take up the time of others. The perception of performance will shift depending on what you look at. It gets more complicated when one considers the contribution to the development of other people or the willingness to train or innovate or help solve problems.
There are lots of examples of these shifting circumstances. And for some people, this illustration shifts around more easily to demonstrate the same effect.

Then, we have the issue of how we perceive things in the workplace/

Is that glass half full or half empty? And the answer to that may depend on whether you like to drink what is in there or not! It’s only half full of that cool, fresh water but it is half empty of that vinegary stuff the Nurse wants you to drink.
And performance can be influenced by perceptions. The Pygmalion Effect is one example. Basically, it suggests that people will perform as they are expected to perform. What you expect is what you get. Wikipedia does a nice job of detailing the early research on this but it is a commonly seen phenomenon in the workplace. If you expect someone to do well, that is what you will commonly find. Wikipedia says it this way: “The Pygmalion effect is a form of self-fulfilling prophecy and, in this respect, people will internalize their positive labels and those with positive labels succeed accordingly.”
Look at it this way:

Those of you with red-green color blindness (mostly us males — about 10% as opposed to 0.4% of females) will certainly see this differently than others. But take a look. How many colors are used to create it? (Answer embedded below.)
Observing and rating performance is often a difficult job, and that observance will spill over to how we motivate and reinforce. Some people we will invariably see as good performers and others as less so, simply because that is how we perceive them. May the heavens help us if our measurement systems do not really manage to track behavior in perfect alignment to company objectives.
So, what are those? Well, those might look like this to many observers:

You know, the funny thing is that all the lines are actually parallel to each other in the above. Yeah, LOOK AGAIN.
And I notice that it helps if you view the one above that as a smaller illustration, since the illusion seems to disappear. Funny how that works, eh? And it is caused by perceptions and how we look at things.
Yeah, there are only three colors in the X above. Your brain does crazy things, right? So who is your top performer? Who is the most engaged and involved in generating ideas for workplace improvement? Who is more motivated? Who gives the best customer service? Who has the most leadership skills and should be sent to a training program? Might be the same person as one of the people below? Which one of these is obviously bigger than the others.

Well, they are all actually just the same, and I would love to do this so that the “little one” is actually bigger than the biggest one — that would make it funner! It is the context of the positioning of the figures in the environment that gives the appearance of them being different. This same kind of illusion can appear everywhere in the workplace and it does get almost impossible to measure or observe everything that you want.
Some people are quite good at doing the design work to make things appear as they do. For example, we have:

I mean, really? Or fabulous street art below:

These artists weave their illusions into their art intentionally to make amazingly spectacular art. These things look real. Yet some things, although they seem real enough, just aren’t going to happen. I think maybe a lot of people think that their organizations work something like this:

It all looks good until you try to actually build one. Or you can be challenged to simply count the squares…

(I can count 35 squares in this — there might be more)
Somehow, I had to simply work the following one in, not because it says that much about people and performance but just because the illusion seems to work so well. Not much square about this one, I guess… Do read the text at the bottom of the black border, though.

I will admit that it took me a long time to get that one…
Back to work!
Yep, there are a lot of issues of perception in the workplace and in the forest around us. We have to pay attention to performance results and we need to measure the right things and have solid performance feedback systems in place to make things operate smoothly.
I hope you liked the basic ideas included within as to how what we think and how we think about things does influence what we see.
If you want to see my thinking about performance results, consider looking at my Feedback Analysis Checklist. You can find it here: Analysis of Feedback
Square Wheels are an excellent metaphor for how things work in most organizations because they get people thinking about and talking about the things that do not work smoothly, with the understanding that people are better problem solvers than problem identifiers and that the ideas for improvement already exist. The metaphor also allows people to focus on the things that don’t work smoothly and the reality that we need to address systems and processes a lot more than people and performance.
We sell a variety of simple toolkits, complete with worksheets at www.performancemanagementcompany.com
Things that get in the way are a lot more demotivating over time than most people realize. When things do not get addressed, people become de-moralized, dis-engaged and un-empowered.
The Square Wheels are Everywhere
and the Round Wheels are already in the wagon,
![]()
![]() For the FUN of It!
For the FUN of It! 

Dr. Scott Simmerman is a designer of team building games and organization improvement tools. Managing Partner of Performance Management Company since 1984, he is an experienced presenter and consultant. Connect with Scott on Google+ – you can reach Scott at scott@squarewheels.com
Follow Scott’s posts on Pinterest: http://pinterest.com/scottsimmerman/
<a rel=”author” href=”https://plus.google.com/u/0/114758253812293832123″ a>


Hi Scott,
The Pygmalion Effect – Johann Wolfgang von Goethe wrote – “If you treat an individual… as if he were what he ought to be and could be, he will become what he ought to be and could be.”