
Moneyball for Managers, Part Two: Using AI and Square Wheels to UN‑Dis‑Empower Supervisors to optimize performance results.
In Part One, I made the case that it is way past time to measure supervisor performance differently, using a Moneyball approach to find and improve the “on‑base” statistics that actually drive results.
This Part Two is more about the how.
-
How do you use AI and the data you already have to start the improvements?
-
How do you build a simple Moneyball scorecard for supervisors?
-
And how do you change the culture so supervisors feel supported by the data instead of threatened by it?
As before, the short version is this:
• AI helps us see the patterns.
• Moneyball logic helps us pick the right metrics.
• Square Wheels® helps us talk about all this in ways that lower fear and raise active involvement.
• We can enable performance improvement with many measurable benefits and impacts.
• Moneyball ideas can be applied to helping the supervisors and front-line managers dramatically improve their performance since the opportunities clearly exist.
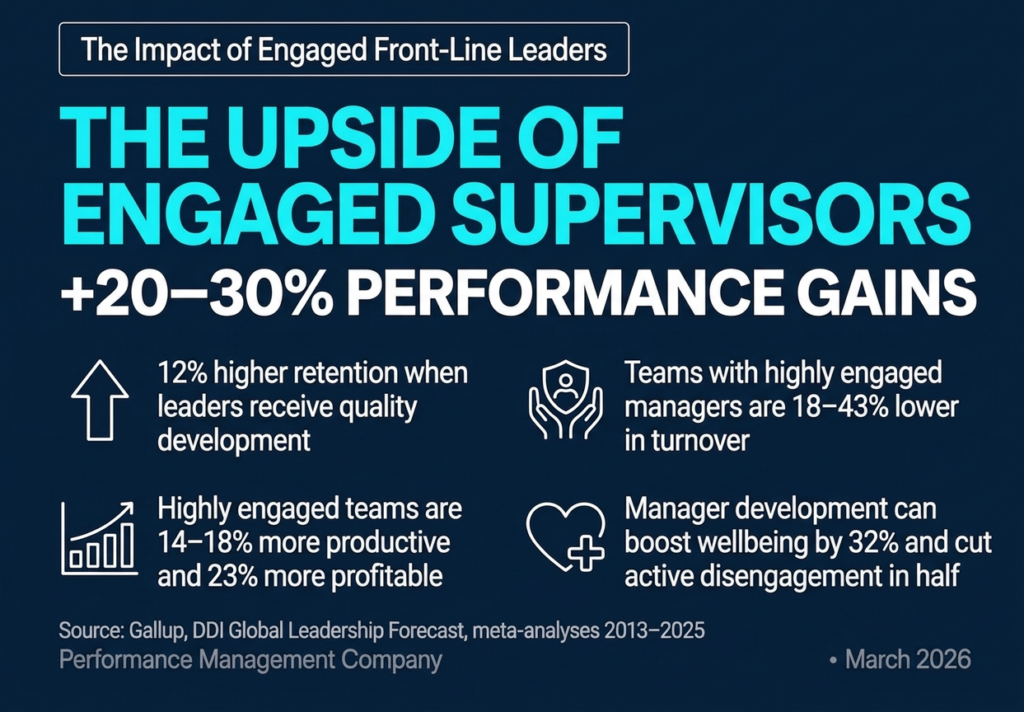
Why? Well, read Part One if this does not make immediate sense. And look at the graphic below, to see a few of the statistics around this opportunity. (And ask yourself: Who but the supervisors influences how ALL the work gets done?)
Step 1: Inventory the Data You Already Own
You probably do not need a big new system to begin. Most organizations are already collecting more supervisor‑relevant data than they realize. It is just scattered in different wagons.
Start by pulling together supervisor‑level information from the systems you already use:
-
Engagement and pulse surveys – team scores, eNPS, key questions on clarity, recognition, and trust.
-
Turnover and retention patterns – voluntary quits, regretted loss, and length of stay by supervisor.
-
Operational results – productivity per FTE, error and rework rates, customer complaints, NPS, on‑time delivery.
-
Safety and reliability – incidents, near misses, lost‑time accidents in operational environments.
-
Process discipline – completion and timeliness of performance reviews, 1:1s, development plans, mandatory training.
-
Existing feedback on leadership – 360s, upward feedback, or manager effectiveness scores where they exist.
Having this information alone lets you ask better questions about opportunities for improvement:
-
Which supervisors get good output without burning people out?
-
Which ones keep good people and export talent to other parts of the business?
-
Where do we see improving quality and safety, not just stable or declining measures?
The very first Moneyball step is simply to see all of that in one place, at the supervisor level, over time. Build the overall data analysis like they did on the whiteboard to show the overall summary of the available information. (And if you are a baseball fan or a fan of metrics, you might find this Guardian article on metrics in baseball being used to give pitchers an advantage over batters. Here.)
Step 2: Use AI to Find Leading Indicators, Not Just Lagging Scores
A true Moneyball approach is not about more stats; it is about better and more meaningful stats. It is not about Win / Loss but about “on base percentage” and “slugging percentage” and “plate discipline” and similar non-obvious statistics the anchor to overall success.
Most modern HR, engagement, and performance systems now include at least some AI or analytics capability. You do not have to be a data scientist to plug in your data and ask it to show you patterns. For example:
-
Where do engagement and retention move together over time?
-
Which teams show sustained gains in quality, safety, or customer outcomes after changes in leadership behavior?
-
Which combination of metrics tends to predict future turnover spikes or performance drops?
Think of this as asking, “What is the on‑base percentage for supervisors?” What behavior and conditions really drive wins over a season, not just in tonight’s game?
You are looking for leading indicators:
-
Early changes in engagement on key questions.
-
Coaching and 1:1 patterns.
-
Patterns in absenteeism, overtime, and workload.
-
Small but steady shifts in quality and customer measures.
AI can certainly help you connect these dots, surfacing supervisors and teams that are quietly getting the combination right, and those at risk long before the annual review catches it. The Truth is Out There!
The output does not have to be fancy. Even a simple dashboard that flags trends (up, flat, down) on a small set of measures can change the supervisory conversation. )
(Read about designing effective Performance Feedback programs here.)
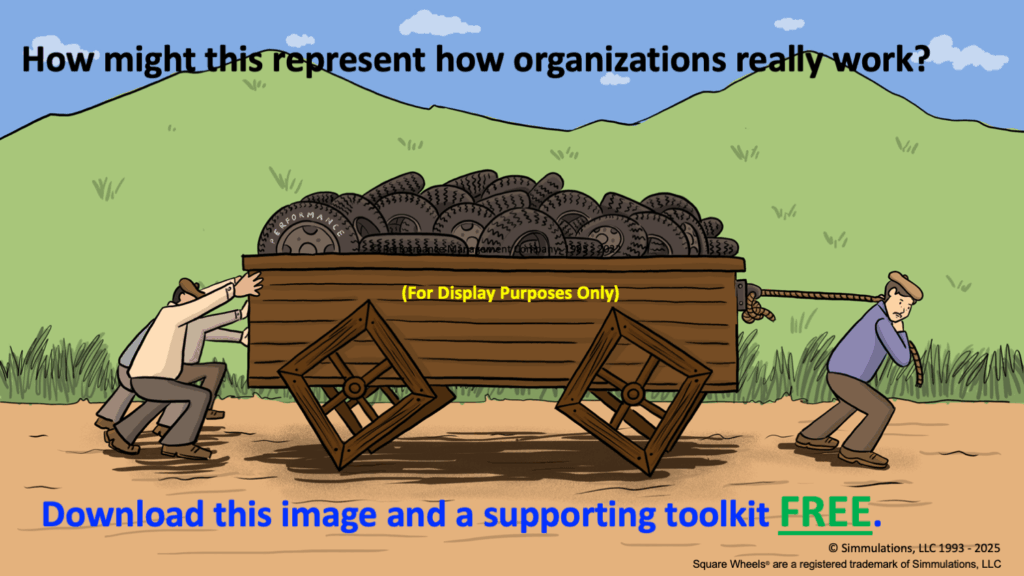
Step 3: Frame the Metrics with Square Wheels, Not as a Threat
Now comes the part where so many efforts crash and burn: communication and engagement to pull people IN as opposed to generating resistance.
Roll out analytics the wrong way and supervisors will understandably feel judged, exposed, and disempowered. It becomes just another Hellscape of numbers used on them, not with them.
This is where Square Wheels® becomes your primary cultural tool for generating a dramatic shift in enablement and engagement.
Click on the image to download it for FREE.
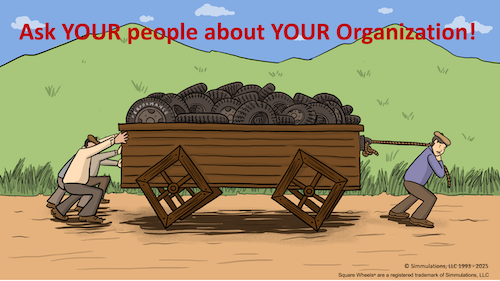
Bring people together and start with the familiar wagon on Square Wheels® One.
-
The current way we evaluate supervisors is the wagon: it rolls, but with a lot of unnecessary friction and thumping and bumping.
-
We can see the Square Wheels: isolated metrics, subjective judgments, last‑minute ratings, politics, and firefighting.
-
The Round Wheels (better data, clearer expectations, AI tools, and shared insights, etc,) are already in the wagon. We just have not taken them out and mounted them.
The image allows people to laugh at the system instead of defending it. It shifts the blame from “bad supervisors” to “bad wagon design.” We can point out the issues, the realities…
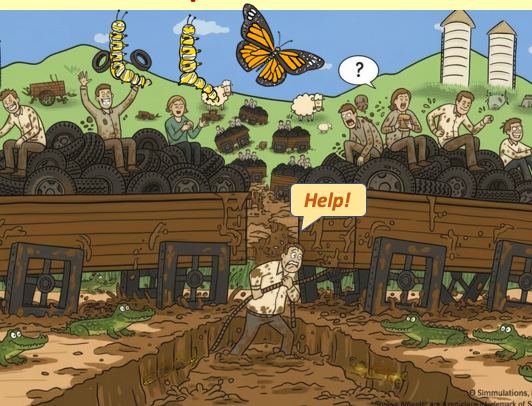
My Supervisor Hellscape generally looks like this, with the butterfly being either the Strategy of the simple idea of Hope!
Anchoring to the Square Wheels One image, you can say:
“We’re not here to use data to beat people up. We’re here to use data to find the Square Wheels in how we manage supervisors and discover better Round Wheels together.”
That is a very different conversation.
Step 4: Co‑Create a “Supervisor Moneyball” Scorecard
In Part One, I suggested four big buckets for a supervisor scorecard:
-
Business Results – productivity, quality, customer outcomes.
-
Team Health – engagement, retention, absence, burnout risk.
-
Talent Development – skills, cross‑training, internal promotions, readiness.
-
Leadership Behavior – coaching cadence, 1:1s, feedback, process discipline.
Part Two is where you build that out with supervisors and leaders in the room.
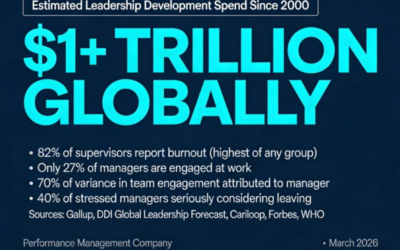
I will note here that your organization may already be operating at a very high level insofar as your performance and engagement numbers show. So, realize that you are an exceptional place because Gallup and other show engagement to he horrible globally: 79% of workers are disengaged. Even IF things are great, consider the ideas included herein as a possible next step for things. Remember that Satchel Paige quote, “Don’t look back. Something might be gaining on you.”
Use your Square Wheels® images to guide a facilitated conversation:
-
“Looking at how we currently judge supervisors, what are the most obvious Square Wheels?”
-
“Which measures are easy to see but poor indicators of real effectiveness?”
-
“What Round Wheels already exist in our data that we have been ignoring?”
-
“If we could only track 8 to 10 things, what would best represent a well‑led team over time?”
At the end of Phase One, note that you are not handing them a finished model. You are co‑creating the Moneyball scorecard with them that they can use to boost their effectiveness.
That co‑creation does three important things:
-
It improves the quality of the measures.
-
It increases buy‑in because people see their fingerprints on the design.
-
It reinforces the idea that metrics are tools for improvement, not weapons.
Step 5: Use AI Dashboards as Coaching Mirrors, Not Ammunition
Once you have a basic scorecard, you can configure dashboards or even simple AI‑generated summaries for each supervisor.
Again, Square Wheels® gives you the shared language of continuous improvement:
-
“Here is what your wagon looks like right now.”
-
“Here are the Round Wheels—where you and your team are rolling smoothly.”
-
“Here are the Square Wheels—places where you may be working a lot harder than you need to.”
Then, you turn the metrics into questions, not verdicts:
-
“What do you see in these patterns?”
-
“What is going on in the work that might explain this?”
-
“What Round Wheel ideas do you and your team have that we could test?”
AI can help by:
-
Automatically updating the scorecard with fresh data.
-
Highlighting trends and outliers that merit discussion.
-
Generating short, plain‑language explanations of what is changing.
But you and your supervisors use those insights in conversations that are framed around improvement and support, not punishment.
That is what I mean by UN‑Dis‑Empowering supervisors: giving them visibility into performance, a voice in how they are measured, and a sense of control over how they respond.
Step 6: Make improvement a Cultural Habit, not a One‑Time Project
Finally, you embed the Moneyball + Square Wheels approach into the rhythm of the business.
A few practical ideas:
-
Quarterly “Round Wheels Reviews”
Supervisors review their dashboards, share wins and stuck points, and update action plans. You always start each session with one of the Square Wheels image to keep the focus on systems and opportunities, not blame.
-
Regular team‑level Square Wheels sessions
Supervisors use the same images with their own teams to surface local friction and ideas. They then connect those ideas back to the scorecard metrics. -
Continuous tuning of the metrics
As you gather experience, you review which measures really predict long‑term success and which can be dropped or replaced. Your Moneyball card evolves. -
No winners and losers
You resist the temptation to turn this into a league table. The goal is to lift all wagons, not just celebrate a few stars and shame the rest.
Over time, you want people to say:
-
“The data helps me see the Square Wheels in my work.”
-
“The Round Wheels are things I can design and test with my team.”
-
“I feel more trusted and more enabled, not more controlled.”
If you can get there, then you are not just doing analytics. You are changing the culture of supervision and leadership. You are creating an operational vision and mission and expectations around desired outcomes.
And note that your supervisors can readily use the images in their communications. The image and a facilitation guide written for supervisors is available here:
Download the FREE Square Wheels® One image and instructor’s guide under a Creative Commons license
Pulling It Together
Moneyball for Managers is not a data project. It is a learning project.
-
AI and statistics help us see patterns that used to be invisible.
-
A Moneyball mindset helps us focus on leading indicators that actually drive performance.
-
Square Wheels tools give us a shared, safe, and fun way to talk about the changes we need to make.
The wagon will still have bumps. It always does. “And the Round Wheels of Today will become the Square Wheels of Tomorrow.”
But by combining better metrics with better conversations, you can build a workplace where supervisors are informed, involved, and UN‑Dis‑Empowered to generate higher levels of performance for the long haul.

Read about my post on using a SkyNet approach for dealing with Toxic Managers:
https://medium.com/@scottsimmerman/build-a-skynet-to-improve-bad-managers-0464f131975d
And here is my joke-post on using Drones to deal with Toxic Managers, the Magnashield 3000:

—
For the FUN of It!
 Dr. Scott Simmerman is a designer of team building games and organization improvement tools.
Managing Partner of Performance Management Company since 1984, he is an experienced presenter and consultant who is trying to retire!! He now lives in Cuenca, Ecuador.
You can reach Scott at scott@squarewheels.com
Learn more about Scott at his LinkedIn site.
Note that I often use Perplexity AI to help research and generate ideas for my posts.
Square Wheels® are a registered trademark of Simmulations, LLC
and images have been copyrighted since 1993,
© Simmulations, LLC 1993 – 2026
What I’m About:
My Square Wheels blog and website exist to help leaders, trainers, and facilitators make work smoother, more engaging, and more human. I focus on practical tools for process improvement, organizational change, and workplace collaboration that spark insight and deliver measurable results.
And I am convinced, after 30+ years of using Square Wheels®, that it is the best facilitation toolset in the world. One can use it to involve and engage people in designing workplace improvements and building engagement and collaboration. It is a unique metaphorical approach to performance improvement and we can easily license your organization to use these images and approaches.
By blending proven facilitation methods, creative problem-solving, and engaging team activities, my mission is to support organizations in building energized, sustainable cultures of involvement and innovation.
Through accessible — and often free — resources and virtual facilitation tools, I aim to help teams everywhere collaborate more effectively, innovate continuously, and take ownership of their improvement journey.
#SquareWheels #InnovationAtWork #TeamEngagement #FacilitationTools #WorkplaceImprovement #EmployeeEngagement #CreativeProblemSolving #OrganizationalDevelopment #LeadershipTools #collaboration #leadership #motivation #communications #enablement #leadership #CreativeCommons #enablingperformance #teamwork #storytelling #storyasking #moneyball #continuousimporovement #enablement


0 Comments