
The Honeymoon is Still Over: Why Morale Crashes After Six Months on the Job and some tools for enablement of people and performance
Consider your newest hire. On day one, they arrive with high hopes, clean energy, and a story in their head about how this job will be better than the last one. Six months later, that story has often unraveled. We have known about this “honeymoon then hangover” pattern for decades, yet the data suggest it is very much alive—and in some ways worse—today.
Back in the early 2000s, Sirota Survey Intelligence studied 1.2 million employees across 52 companies and found something sobering: in about 85% of companies, employee morale sharply declined after the first six months on the job and then continued to deteriorate over time.
Enthusiasm never returned to the level people had when they walked in the door. This wasn’t an isolated HR complaint; it was a structural pattern in large, successful organizations. The message was clear: people don’t show up disengaged — organizations teach them to disengage.
People don’t show up disengaged.
Organizations teach them to disengage.
You might argue that this 2006 statistic is old. Work has changed. We have hybrid work, AI, well‑being apps, and entire industries built around employee engagement. Surely things have improved? There are all sorts of sources for motivational tools and stuff. Right?
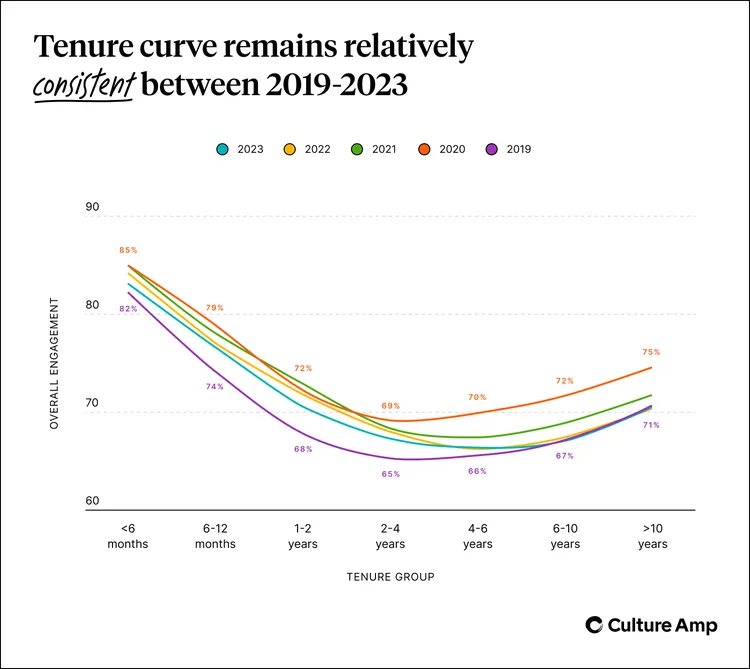
Unfortunately, new data continues to paint a very similar picture. Culture Amp’s global analysis of 1.76 million employees across 2,901 organizations shows a distinct U‑shaped pattern in engagement: a sharp decrease in the first couple of years, a low point around four to six years of tenure, and then a slow improvement that never quite reaches the early honeymoon level again. The myth that “people get more engaged the longer they stay” simply does not hold up empirically.
“Overall, we find that while commitment increases with tenure, it never rises above how employees felt in those initial six months.” Culture Amp, 2024
Even more concerning is how quickly early‑tenure perceptions slide. Culture Amp finds that employees with 6–12 months of tenure already score noticeably lower — by up to four percentage points — on half of the engagement questions compared with those who have been there less than six months. Within that first year, “present commitment,” whether people are actively thinking about going somewhere else, drops ten points (from 74% to 64%) and reaches its lowest point (49%) among employees with four to six years in the organization.
In other words, the seeds of disengagement and departure are being planted in the first months, they blossom into job‑search behavior in the early years, and we often label the result as “poor retention” instead of “poor experience design.”
Newer sources on employee experience reinforce this point from another angle. A nice 2026 Paycor review of employee experience statistics notes that employees with less than six months’ tenure already report lower engagement, inclusion, and wellbeing than more tenured colleagues, and show a 21‑percentage‑point lower intent to stay. Nearly 39% of them intend to leave within the next year — and that share is rising.

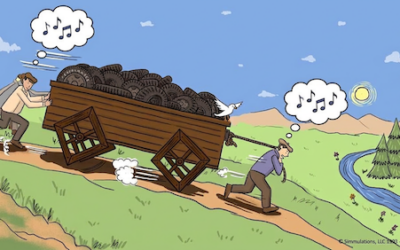
For so many new hires, the work tends to feel like this, and it is hard to get out of the mud and deal with the Silos and the Spectator Sheep.
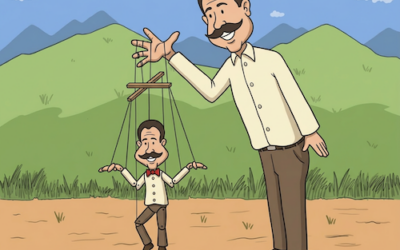
We are not just failing to sustain the honeymoon; we are failing to build a bridge from the new hire honeymoon into a realistic, engaging long‑term relationship with the organization. THIS is generally an issue of the supervisor, and we know that it is a real Hellscape out there for most supervisors.
Turnover numbers for new hires tell the same story in economic terms. Work Institute’s analyses, summarized in retention stats, indicate that about one‑third of all turnover occurs in the first year of employment. That is precisely when organizations have invested heavily in recruitment, selection, and onboarding, but have not yet received much productivity in return. Early departures are not just a morale problem; they are an extremely expensive design flaw in how we bring people into the system.
Layer on top of this the macro‑trend that overall engagement has continually slipped. Gallup’s 2025 data show that U.S. employee engagement fell to its lowest level in a decade in 2024, with only 31% of employees classified as engaged and, scarily, 17% actively disengaged.
The largest drops in engagement are among workers under 35, who are disproportionately represented in early‑tenure roles. This means your newest employees — those you most need to integrate, develop, and retain — are also the ones most likely to feel unclear about expectations, under‑recognized, poorly equipped, and under‑developed.
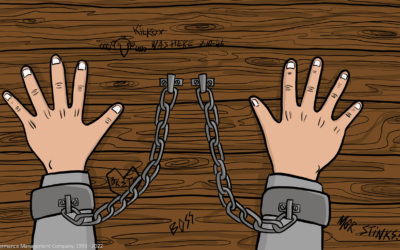
What drives this continuing crash in morale after six months? The Sirota team argued years ago that it is not a mystery of human nature; it is a consequence of how organizations are managed. Their research pointed to managers and systems built around controlling the “5% who are allergic to work” instead of enabling the 95% who want to do a good job.
When policy, process, and practice assume laziness and risk, workers generate frustration and distrust. Culture Amp’s more recent data show that the steepest early declines tend to appear in areas like recognition, growth, and belief that leaders will act on feedback. These are all things that live squarely in daily management behavior of our supervisors and how we do our organizational design.
If we combine these threads, a coherent pattern emerges.
People join organizations with hope and energy. Within months, they run into avoidable friction: unclear expectations, inconsistent onboarding, weak feedback, and managers who are overwhelmed or untrained in people leadership. They discover that many of the promises made during recruitment are “aspirational” at best. By the time they reach the six‑ to twelve‑month mark, they are no longer deciding whether they likethe job; they are deciding whether to endure it, redesign it, or exit. The honeymoon doesn’t end because employees become cynical; it ends because the system doesn’t earn their continued enthusiasm.
So what has changed since that 2006 Sirota data point? The short answer is: not enough. We have more tools, more data, and more talk about engagement and experience, but the structural pattern—sharp early decline, long stretch of disillusionment, partial recovery late in tenure—remains stubbornly consistent across time and across global datasets. If anything, the stakes are higher: talent markets are more fluid, younger workers’ expectations are higher, and the tolerance for low‑quality work experiences is lower.
For leaders and managers, the implication is simple and uncomfortable: onboarding never really ends. The first six to twelve months are not just about paperwork, systems access, and a welcome lunch. They are about building a reliable, evidence‑based experience that sustains the natural enthusiasm people bring to the job instead of squandering it.
That means designing for clarity of role, building supervisor capability in recognition and coaching, making progress and development visible early, and closing the loop on employee feedback.
When those fundamentals are missing, you don’t need a survey to tell you what will happen at the six‑month mark. You can predict the crash from Sirota’s original data and everything the newer data still scream today.
So, what do we do to address this? The Truth is Out There!
We must focus on the supervisors and here are three different blog posts of mine about how supervisors and workers can be positively impacted and un-dis-empowered, with some FREE tools and frameworks for improvement:
It’s about your Supervisors, stupid:
https://performancemanagementcompany.com/2026/01/28/its-about-your-supervisors-stupid/
Enabling Supervisors
https://performancemanagementcompany.com/2026/01/30/enabling-front-line-supervisors-with-square-wheels-tools/
State of Facilitation, Flow and Supervisors
https://performancemanagementcompany.com/2026/02/10/from-supervisor-hellscape-to-flow-facilitation-tools/
Appendix and References:
From Archie, an “unverified by me” summary of employee statistics:
References:
-
Personnel Today. (2005, March 28). Familiarity breeds contempt as bad managers rule roost. Retrieved March 26, 2026, from https://www.personneltoday.com/hr/familiarity-breeds-contempt-as-bad-managers-rule-roost/
-
Al-Ghraibeh, A. et al. (2024). Empathetic AI for enhanced workplace engagement. Uppsala University.
https://uu.diva-portal.org/smash/get/diva2:1864946/FULLTEXT01.pdf -
Culture Amp. (2024, February 14). An early honeymoon: How to improve the first-year experience. https://www.cultureamp.com/blog/employee-honeymoon-phase
-
Archie. (2025, December 1). Employee experience statistics in 2026: Trends & challenges. https://archieapp.co/blog/employee-experience-statistics/
-
Paycor. (2026, March 4). 28 employee retention statistics employers need to know . https://www.paycor.com/resource-center/articles/employee-retention-statistics/
-
Work Institute. (2022, October 19). New hire turnover in the first year. https://workinstitute.com/first-year-turnover/
-
Gallup. (2025, January 13). U.S. employee engagement sinks to 10-year low. https://www.gallup.com/workplace/654911/employee-engagement-sinks-year-low.aspx
-
Dooley, R. (2025, January 14). U.S. employee engagement keeps dropping, hits 10-year low. Forbes. (But it also talks of “empowering managers to solve the engagement problem.) https://www.forbes.com/sites/rogerdooley/2025/01/14/us-employee-engagement-keeps-dropping-hits-10-year-low/
—
For the FUN of It!
 Dr. Scott Simmerman is a designer of team building games and organization improvement tools.
Managing Partner of Performance Management Company since 1984, he is an experienced presenter and consultant who is trying to retire!! He now lives in Cuenca, Ecuador.
You can reach Scott at scott@squarewheels.com
Learn more about Scott at his LinkedIn site.
Note that I often use Perplexity AI to help research and generate ideas for my posts.
Square Wheels® are a registered trademark of Simmulations, LLC
and images have been copyrighted since 1993,
© Simmulations, LLC 1993 – 2026
What I’m About:
My Square Wheels blog and website exist to help leaders, trainers, and facilitators make work smoother, more engaging, and more human. I focus on practical tools for process improvement, organizational change, and workplace collaboration that spark insight and deliver measurable results.
And I am convinced, after 30+ years of using Square Wheels®, that it is the best facilitation toolset in the world. One can use it to involve and engage people in designing workplace improvements and building engagement and collaboration. It is a unique metaphorical approach to performance improvement and we can easily license your organization to use these images and approaches.
By blending proven facilitation methods, creative problem-solving, and engaging team activities, my mission is to support organizations in building energized, sustainable cultures of involvement and innovation.
Through accessible — and often free — resources and virtual facilitation tools, I aim to help teams everywhere collaborate more effectively, innovate continuously, and take ownership of their improvement journey.
#SquareWheels #InnovationAtWork #TeamEngagement #FacilitationTools #WorkplaceImprovement #EmployeeEngagement #CreativeProblemSolving #OrganizationalDevelopment #LeadershipTools #collaboration #leadership #motivation #communications #enablement #leadership #CreativeCommons #enablingperformance #teamwork #storytelling #storyasking #morale

0 Comments