
Moneyball for Managers: It’s Past Time to Measure Supervisor Performance Differently so here are some pragmatic approaches for improvement.
Most every organization is sitting on a gold mine of supervisor performance data, but they are still managing supervisors with intuition, anecdotes, and annual review rituals. And the horrible Hellscape that is out there must be addressed and so much can be gained.
A Moneyball approach offers a better path: identify the metrics that actually predict team success and performance improvement, using those indicators to spot hidden managerial strengths and weaknesses, and then turning the findings into better coaching, staffing, and organizational results. We have the metrics; we just don’t use them effectively. So, let’s find those “On Base Statistics” and improve them.
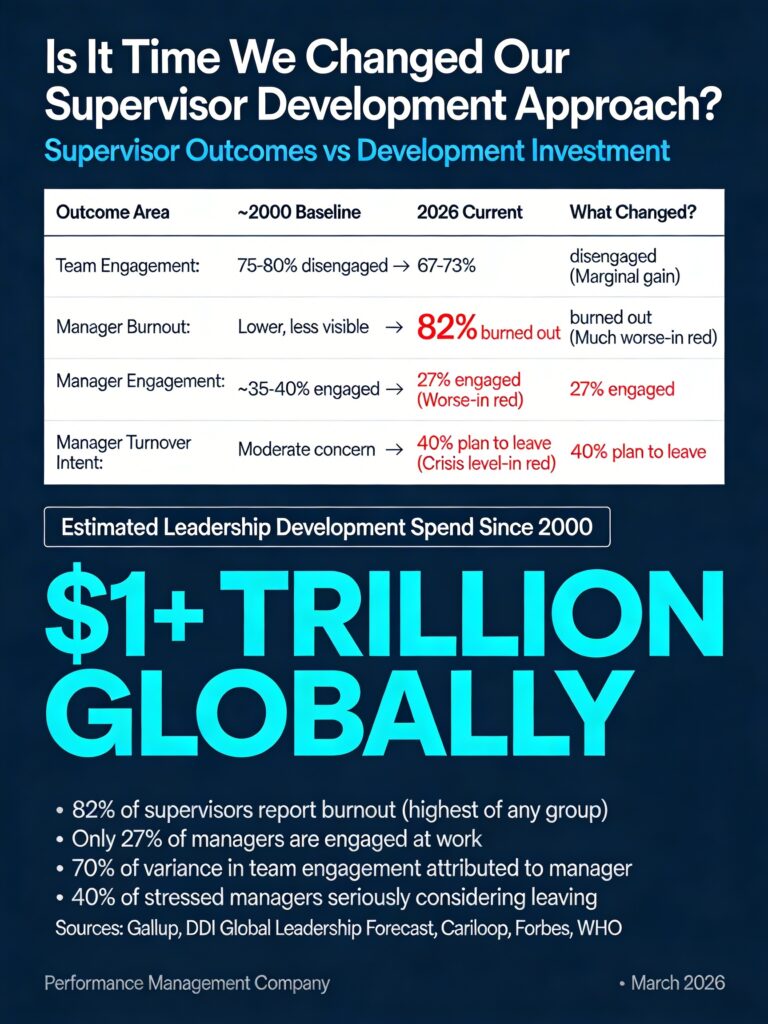
That idea matters because supervisors are not just another layer in the org chart. They shape almost everything from engagement, retention, quality, safety, development, productivity and day-to-day execution even more directly than most senior leaders ever can. Who but the supervisors actually implement organizational change? We’ve been closely studying this for 50 years but nothing seems to change.
Read some numbers that supervisors directly impact:
The Problems with Traditional Supervisor Evaluation
In many workplaces, the current approach to evaluating supervisors looks a lot like baseball scouting before advanced analytics. People rely on impressions, tenure, confidence, presentation skills, and whatever happened most recently. Those judgments are not useless, but they are incomplete, inconsistent, and often biased toward visible style rather than measurable contribution.
(Go watch Moneyball again! Here is the explanation of using the analytics.)
Baseball learned that batting average did not tell the whole story. On-base percentage, slugging efficiency, and other undervalued measures provided a better picture of who helped teams win games. Organizations face a similar challenge with supervisors: they often rate visible busyness, toughness, or charisma while missing the measurable drivers of team performance and talent development. And this was true for every team in every league and it spilled out into other sports. Metrics!
If your goal is organizational performance improvement, then the real question is not, “Do people like this supervisor?” The better question is, “What measurable effect does this supervisor have on the people, processes, and results that matter most?” That is the workplace version of Moneyball.
The Metrics Most Organizations Already Have
The good news is that most organizations already possess more useful supervisor data than they realize. The bad news is that these data usually live in different systems, are reviewed in isolation, and are almost never combined into a supervisor effectiveness picture.
Common existing measures include:
-
Employee engagement or pulse survey results by team.
-
Voluntary turnover, regretted loss, and retention patterns by supervisor.
-
Quality, error, rework, complaint, and customer service indicators for the work unit.
-
Safety incidents, near misses, and lost-time metrics in operational settings.
-
Productivity indicators such as output per employee, cycle time, resolution time, or schedule adherence.
-
Completion of reviews, check-ins, training, and other required supervisory processes.
-
360-degree feedback or leadership assessment data where those processes already exist.
That is already enough to begin asking sharper questions. Which supervisors get solid output without burning people out? Which ones retain strong performers? Which teams improve quality while keeping engagement high? Which supervisors produce talent that gets promoted across the business?
Those are not soft questions. They are performance improvement questions.
The Metrics Most Organizations Are Missing
The next step is to add the measures that are usually discussed but not captured well. The Moneyball approach worked because it valued what others ignored. For supervisor performance, the missing variables would involve coaching quality, clarity, development, and team climate.
Useful additions include:
-
Frequency and quality of one-to-one coaching conversations.
-
Role clarity, recognition, and psychological safety scores that are manager-influenced and visible in short pulse surveys.
-
Speed of skill growth, cross-training, certification, and readiness among direct reports.
-
Internal promotion and mobility rates coming from each supervisor’s team.
-
Patterns of absenteeism, overtime, and burnout risk at team level.
-
Behavioral consistency measures such as response time on issues, follow-through on commitments, and completion of development plans.
The point is not to measure everything. It is to find the handful of leading indicators that best predict stronger team results over time. In baseball, that meant looking beyond the flashy stats of “Batting Average” or “Home Runs.” In organizations, it means looking beyond annual ratings and managerial reputation.
From Scorekeeping to Decision-Making
A true Moneyball approach does more than create a dashboard. It changes how leaders think about supervisor contribution. Instead of asking who appears strong, organizations should ask who consistently produces the outcomes they value under comparable conditions. Objectively.
That opens the door to a more rigorous supervisor scorecard, one that blends results, people outcomes, and development indicators. A useful model might include four categories: business results, team health, talent development, and leadership behavior. When those are tracked together, organizations can identify supervisors who are genuine talent multipliers, not just task monitors or those who contribute the most in the meetings.
This also helps separate symptoms from causes. For example, a workgroup with decent short-term output but high turnover and declining engagement may not actually be well led. Likewise, a supervisor with moderate output and exceptional retention, development, and quality improvements may be creating long-term organizational value that conventional measures ignore.
Where my Square Wheels Tools Fit
This is exactly where Square Wheels® becomes more than a metaphor. It becomes an implementation tool. I have written extensively in dozens of blogs about how to use the tools in different ways and my suggestion is that you frame up your own question and ask your AI for output. Below, I wanted to share some ideas to get things rolling.
One of the biggest barriers to a Moneyball approach in management is not statistical technique. It is conversation. People resist metrics when they feel judged, exposed, or reduced to numbers. Supervisors may hear “measurement” as punishment, and senior leaders may struggle to discuss management quality without slipping into blame, politics, or unsupported opinion.
Square Wheels images offer a safer, smarter and more engaging way into those discussions. The metaphor allows people to see that poor results are often not about bad people. They are about inherited assumptions, outdated systems, invisible friction, and a failure to notice the obvious opportunities for improvement. That is exactly the terrain where supervisor analytics can either become threatening or become useful.
Below is Square Wheels One, the main image that is generally used to get conversations started about issues and opportunities. Click on the image to be able to download this image that you can use for FREE, along with an instructor’s guide that explains some details. We have many other images available for use.
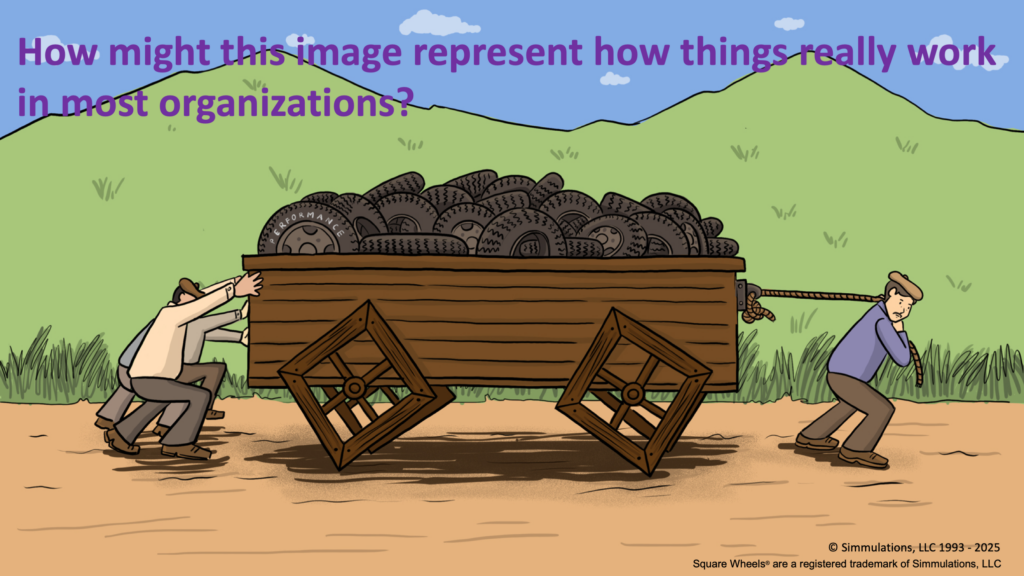
Click on this image to download Square Wheels One
Used well, Square Wheels communications tools can help leaders and managers explore questions such as:
-
What are the Square Wheels in how we currently judge supervisors and performers?
-
Which measures are easy to see but poor indicators of real effectiveness?
-
What “round wheels” already exist in our data that we are ignoring or not optimizing?
-
Where are we creating friction for supervisors by measuring activity instead of contribution?
-
How can better data help coaching and mentoring rather than compliance?
That matters because implementation is a social process, not just a technical one. The organization does not simply need a scorecard. It needs shared understanding, trust in the logic, and broad active ownership involvement of the measures being used. Square Wheels is uniquely suited to generate those conversations because it lowers defensiveness while increasing insight. It is a tool that focuses on continuous improvement of workplace practices of all kinds.
A Practical Path Forward
Organizations do not need to build a perfect analytics model on Day One. They can start with what they already have, test the relationships, and improve the scorecard over time.
A practical rollout could look like this:
-
Start with 6 to 10 existing supervisor-relevant indicators, especially engagement, turnover, quality, safety, productivity, and completion of key people-management practices.
-
Group those measures into a simple framework of results, team health, development, and behavior.
-
Use Square Wheels metaphors in sessions with leaders and supervisors to discuss what current measures miss and which added indicators would improve understanding. Generate alignment towards continuous improvement.
-
Pilot the model in one function or business unit before broad rollout. Find the optimal ways to communicate and involve / engage people in the performance improvement initiative(s).
-
Position the analytics as a coaching and learning system first, not as a disciplinary instrument.
- Avoid the creation of winners and losers in the process of generating overall improvement. Generate peer support for the tools and the process, not competition.
-
Review the findings over time to identify which metrics best predict sustained performance and talent outcomes. Take the long view. Change the culture.
The larger opportunity is not simply better measurement. It is better management over the long term. It is about optimizing performance.
When organizations can identify what effective supervisors actually do, they can select better leaders, coach more precisely, improve engagement, reduce preventable turnover, and build more capable teams.
Moneyball changed baseball and other sports because it challenged tradition with evidence. A similar shift can improve workplace performance, especially at the supervisory level where culture and execution meet every day. And Square Wheels® tools for communications and enablement can help organizations make that shift in a way that is practical, participative, and far more likely to stick.
This post is about:
-
A “Moneyball” approach to supervisor performance metrics in organizations
-
Data-driven manager effectiveness using engagement and turnover analytics
-
Using square wheels metaphors to improve supervisor evaluation and coaching
Find Part Two here: https://performancemanagementcompany.com/2026/04/03/moneyball-for-managers-part-two/
—
For the FUN of It!
 Dr. Scott Simmerman is a designer of team building games and organization improvement tools.
Managing Partner of Performance Management Company since 1984, he is an experienced presenter and consultant who is trying to retire!! He now lives in Cuenca, Ecuador.
You can reach Scott at scott@squarewheels.com
Learn more about Scott at his LinkedIn site.
Note that I often use Perplexity AI to help research and generate ideas for my posts.
Square Wheels® are a registered trademark of Simmulations, LLC
and images have been copyrighted since 1993,
© Simmulations, LLC 1993 – 2026
What I’m About:
My Square Wheels blog and website exist to help leaders, trainers, and facilitators make work smoother, more engaging, and more human. I focus on practical tools for process improvement, organizational change, and workplace collaboration that spark insight and deliver measurable results.
And I am convinced, after 30+ years of using Square Wheels®, that it is the best facilitation toolset in the world. One can use it to involve and engage people in designing workplace improvements and building engagement and collaboration. It is a unique metaphorical approach to performance improvement and we can easily license your organization to use these images and approaches.
By blending proven facilitation methods, creative problem-solving, and engaging team activities, my mission is to support organizations in building energized, sustainable cultures of involvement and innovation.
Through accessible — and often free — resources and virtual facilitation tools, I aim to help teams everywhere collaborate more effectively, innovate continuously, and take ownership of their improvement journey.
#SquareWheels #InnovationAtWork #TeamEngagement #FacilitationTools #WorkplaceImprovement #EmployeeEngagement #CreativeProblemSolving #OrganizationalDevelopment #LeadershipTools #collaboration #leadership #motivation #communications #enablement #leadership #CreativeCommons #enablingperformance #teamwork #storytelling #storyasking #moneyball #data-driven


0 Comments